
Trading, with its intricate dance of strategy and timing, is an art that takes time to master. It's a realm where experience and a deep understanding of market dynamics play a crucial role, guiding traders on when and how to navigate the complexities of buying and selling. The path to becoming a successful trader is paved with patience, discipline, and an unwavering commitment to learning.
When it comes to trading, the adage "timing is everything" couldn't be more accurate. Aspiring traders must recognise that the opportune moment to execute a trade arises from a culmination of factors, including the specific market conditions and the nature of the asset being traded. This critical understanding is honed through experience and a keen observance of market trends.
The art of trading is akin to a long game. It's not about quick wins but rather a patient journey towards accumulating profits over time. Discipline becomes a trader's best friend as they navigate the ever-fluctuating tides of financial markets. Market conditions are like shifting sands, constantly changing and evolving. This dynamic environment necessitates adaptability and a steadfast commitment to staying informed. In the contemporary trading landscape, diversity is key. Modern traders engage in a broad spectrum of market assets, which necessitates the skill of diversification. It's not just about putting all your eggs in one basket; it's about carefully selecting a mix of assets that strike a balance between risk and potential returns. This process involves a thoughtful assessment of market trends, economic indicators, and even geopolitical events that can impact asset performance.
Different types of trading styles
Within the realm of trading, various styles emerge, each catering to different personalities and risk appetites.
- Scalping, the short-term precision game, involves swift execution and a laser focus on small price fluctuations. Day trading, on the other hand, strikes a balance between scalping and a longer-term view, eliminating the risk of overnight market shocks.
- For those with a more flexible schedule, Swing trading provides an opportunity to hold positions for several days or even weeks. This style accommodates individuals who have full-time jobs or other commitments, allowing them to engage with the market during their leisure time. It's a harmonious blend of trading and lifestyle
- However, the art of trading isn't solely for the leisurely. Position trading delves into the world of long-term price movements, where traders aim to extract maximum profit from major shifts in prices. This requires a meticulous analysis of weekly and monthly price charts, a synergy of technical indicators, and a deep dive into fundamental analysis to identify strategic entry and exit points.
Choosing the right timeframe is important
Amid these styles, the choice of the right timeframe becomes paramount. Novice traders are advised to embrace higher timeframes due to their reduced noise and enhanced clarity. Trading is akin to a finely orchestrated symphony; the timing of each note is crucial to the harmonious composition of success.
Long-term investors are akin to patient gardeners, nurturing positions that may span months or even years. This approach often yields substantial returns, showcasing the power of time as a value creator. In contrast, traders operating in shorter timeframes undertake a more intense analytical journey, driven by the wealth of data that fuels trend determination and entry/exit points.
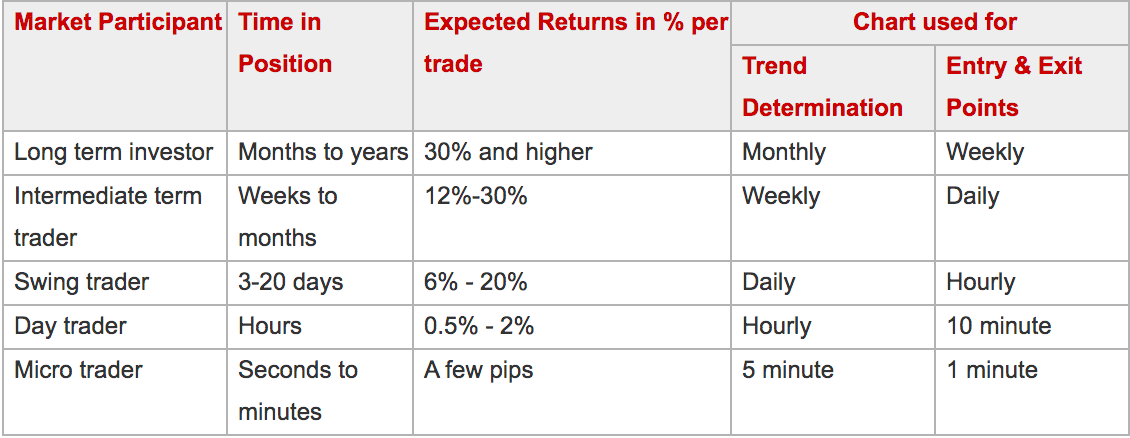
However, exceptions to these rules exist. Seasoned traders and institutions occasionally dive into lower timeframes, engaging in high-frequency trading to capitalise on swift market movements. Such endeavours are a testament to the depth of trading knowledge and the advanced strategies deployed by these experts.
Yet, a word of caution rings true: the journey to becoming a proficient trader is paved with experience. The art of interpreting charts and predicting market movements is a skill that can only be honed through consistent practice, analysis, and a deep dive into various technical indicators.
Types of Technical Indicators
Technical indicators, the trader's compass, provide invaluable insights.
- Leading Indicators akin to trend forecasters, signal the inception of trends by leveraging shorter calculation periods to anticipate price movements. The likes of Stochastic, MACD, and RSI exemplify this category, providing traders with a heads-up on potential shifts.
- Conversely, Lagging indicators follow the price action, offering signals after trends or reversals have already been set in motion. These indicators are akin to historical detectives, piecing together the narrative of market movements. Moving averages, a widely used indicator, fall into this category.
These indicators belong to various types, each with its own function. :
- Trend Indicators gauge the direction and strength of trends, leveraging price averages to establish a baseline. When prices surpass the average, it signifies a bullish trend; when they fall below, a bearish trend is indicated. Notable examples include moving averages, MACD, and PSAR.
- Momentum Indicators are akin to speedometers, identifying the velocity of price movement by comparing prices over a specific time period. They can also be harnessed to analyse volume trends, adding another layer of insight to market analysis. Stochastic oscillators, CCI, and RSI exemplify this category, aiding traders in gauging the intensity of price movements.
- Volatility Indicators, on the other hand, focus on the rate of price movement, disregarding direction. Drawing inspiration from historical highs and lows, these indicators provide crucial information about the scope of buying and selling activity. Bollinger Bands, average true range, and standard deviation fall into this group, helping traders navigate the sometimes turbulent waters of market volatility.
- Volume Indicators measures the strength of a trend or confirm a trading direction based on some sort of averaging or smoothing of raw volume. The strongest trend often occurs when volume increases; in fact, it is the increase in trading volume that can lead to large price movements. Chaikin oscillator, on balance volume(OBV) and volume rate of change are some of volume indicators.
Learn about Support and Resistance Levels
Another aspect of technical analysis involves understanding support and resistance levels, a concept that enhances chart interpretation. Peaks and troughs, those pivotal points on price charts, are more than just data points. They hold a fundamental significance that, when deciphered correctly, can guide traders towards informed decisions.
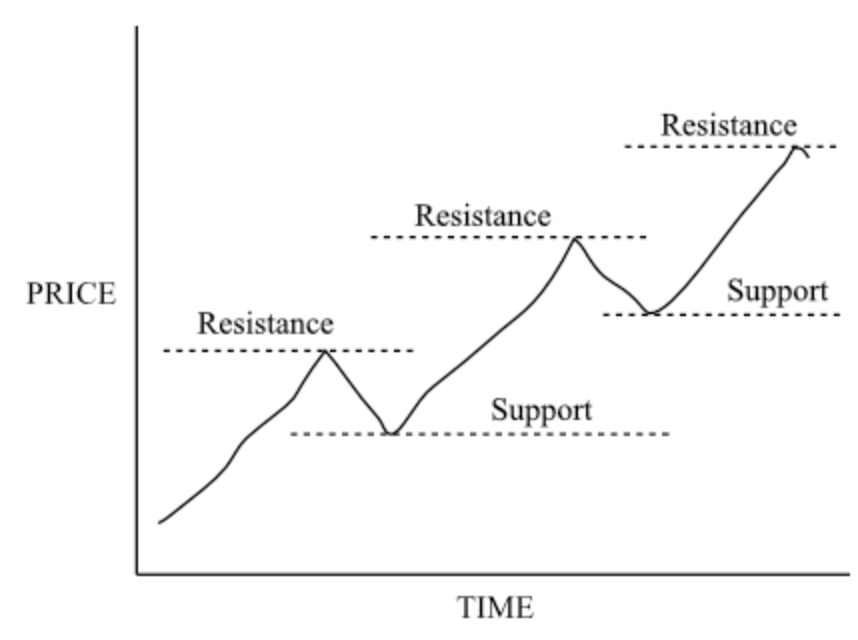
Imagine support and resistance levels as the scaffolding of a price chart. The troughs, those valleys where prices temporarily rest, represent support points. Here, buying interest outweighs selling pressure, creating a natural equilibrium that prevents prices from plummeting further. This delicate balance between supply and demand results in a rebound effect, as prices rise from these support levels.
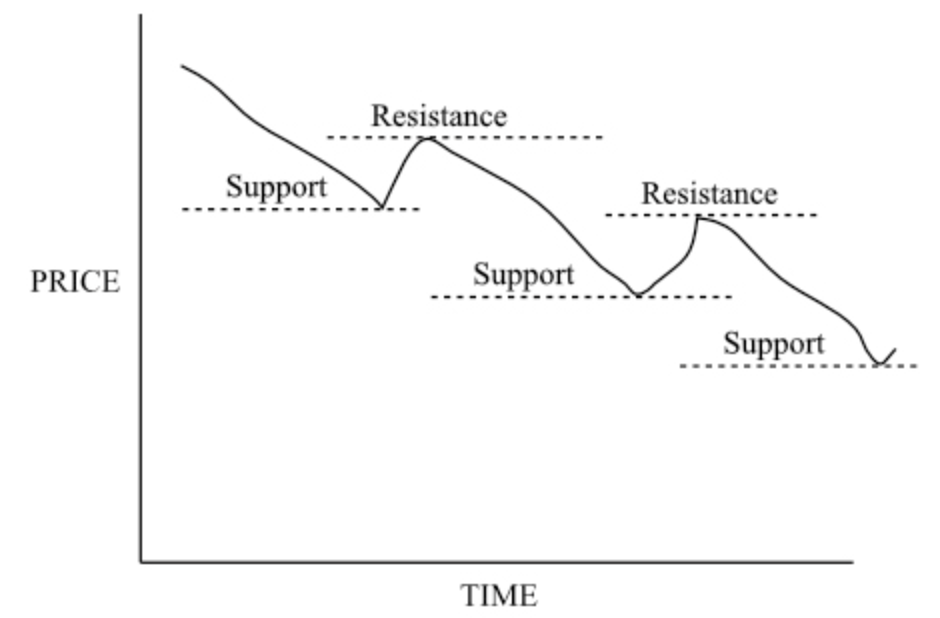
Conversely, the peaks in the price chart represent resistance points. These summits are the culmination of upward price movement, often triggering profit-taking and selling activity. The price levels at these peaks become points of resistance, as buyers become more hesitant due to the higher price tag. This leads to a reduction in buying pressure and an eventual downturn in price.
And the most important is RISK MANAGEMENT
However, it's vital to underscore that all these strategies and insights cannot bear fruit without the cornerstone of effective risk management. For a trader, risk management isn't just a tool—it's a way of life. Without it, even the most brilliant trading strategies can crumble under the weight of unpredictability. Risk management is akin to the helm of a ship, steering a trader away from treacherous waters and towards profitable horizons.
Risk management involves identifying, analysing, and mitigating uncertainty in investment decisions. It's the process that helps traders navigate through the murky waters of risk and return. In the realm of investments, risk is often portrayed as the antagonist, but it's also an indispensable companion on the journey to desirable performance.
A common definition of investment risk is a deviation from an expected outcome.
Investment risk, in essence, is the deviation from an expected outcome. It's the element of unpredictability that introduces both challenge and opportunity. Recognising and understanding this risk is what separates casual traders from the skilled, those who dance skilfully amidst the volatility of the market.
To delve even deeper into the world of trading, consider studying technical analysis, risk management, portfolio analysis, and fundamental analysis. These domains provide the keys to unlocking a comprehensive understanding of the intricacies of financial markets.
In conclusion, the world of trading is an intricate tapestry woven from experience, strategy, and timing. It's a realm where understanding the rhythm of the market and making informed decisions is of paramount importance. Trading isn't just about numbers and charts; it's about deciphering the language of the market, understanding its nuances, and embarking on a journey of growth and profitability.
So, let these insights serve as your guide on this exciting journey. Embrace the principles of effective trading, master the art of interpreting technical indicators, and harness the power of risk management. By doing so, you'll navigate the often unpredictable seas of trading with skill and confidence.
As you step into the world of trading, armed with knowledge and insights, may your trading endeavours be marked by success, informed decisions, and, above all,
Happy trading!
Subscribe to Plezna
Crypto knowledge delivered, right to your inbox